
Overview
The Black Box records your flight telemetry: altitude, airspeed, vertical rate, attitude, control input, and G-force, captured automatically from the moment a flight begins to the moment it ends, with nothing to configure and nothing to start. That telemetry stays stored with each flight for as long as it is in your Logbook.
With the Delta 4 update, the Black Box gets a major expansion. The all new Black Box AI analyses that recorded data and presents it as something you can actually use: a phase-by-phase Highlights section, automatic performance ratings for your takeoff, landing and procedures, a narrative Flight Analytics Report written in plain language, and a PDF export that packages the whole analysis into a single professional document.
This guide covers the full Black Box — the charts and timeline that have always been there, and everything Black Box AI adds on top.
This feature requires a Premium subscription.
Opening the Black Box
The Black Box button appears in several places across the app:

- In the Logbook, select any completed flight and tap BlackBox in the bottom bar.
- In Memories, tap the BlackBox button on any flight card.
- Inside a flight’s gallery, tap the BlackBox button in the top bar.
Every time you open a flight’s Black Box, the AI analysis runs automatically in the background — it takes just a moment. When it finishes, the Highlights strip appears at the top of the view with your results.
Highlights
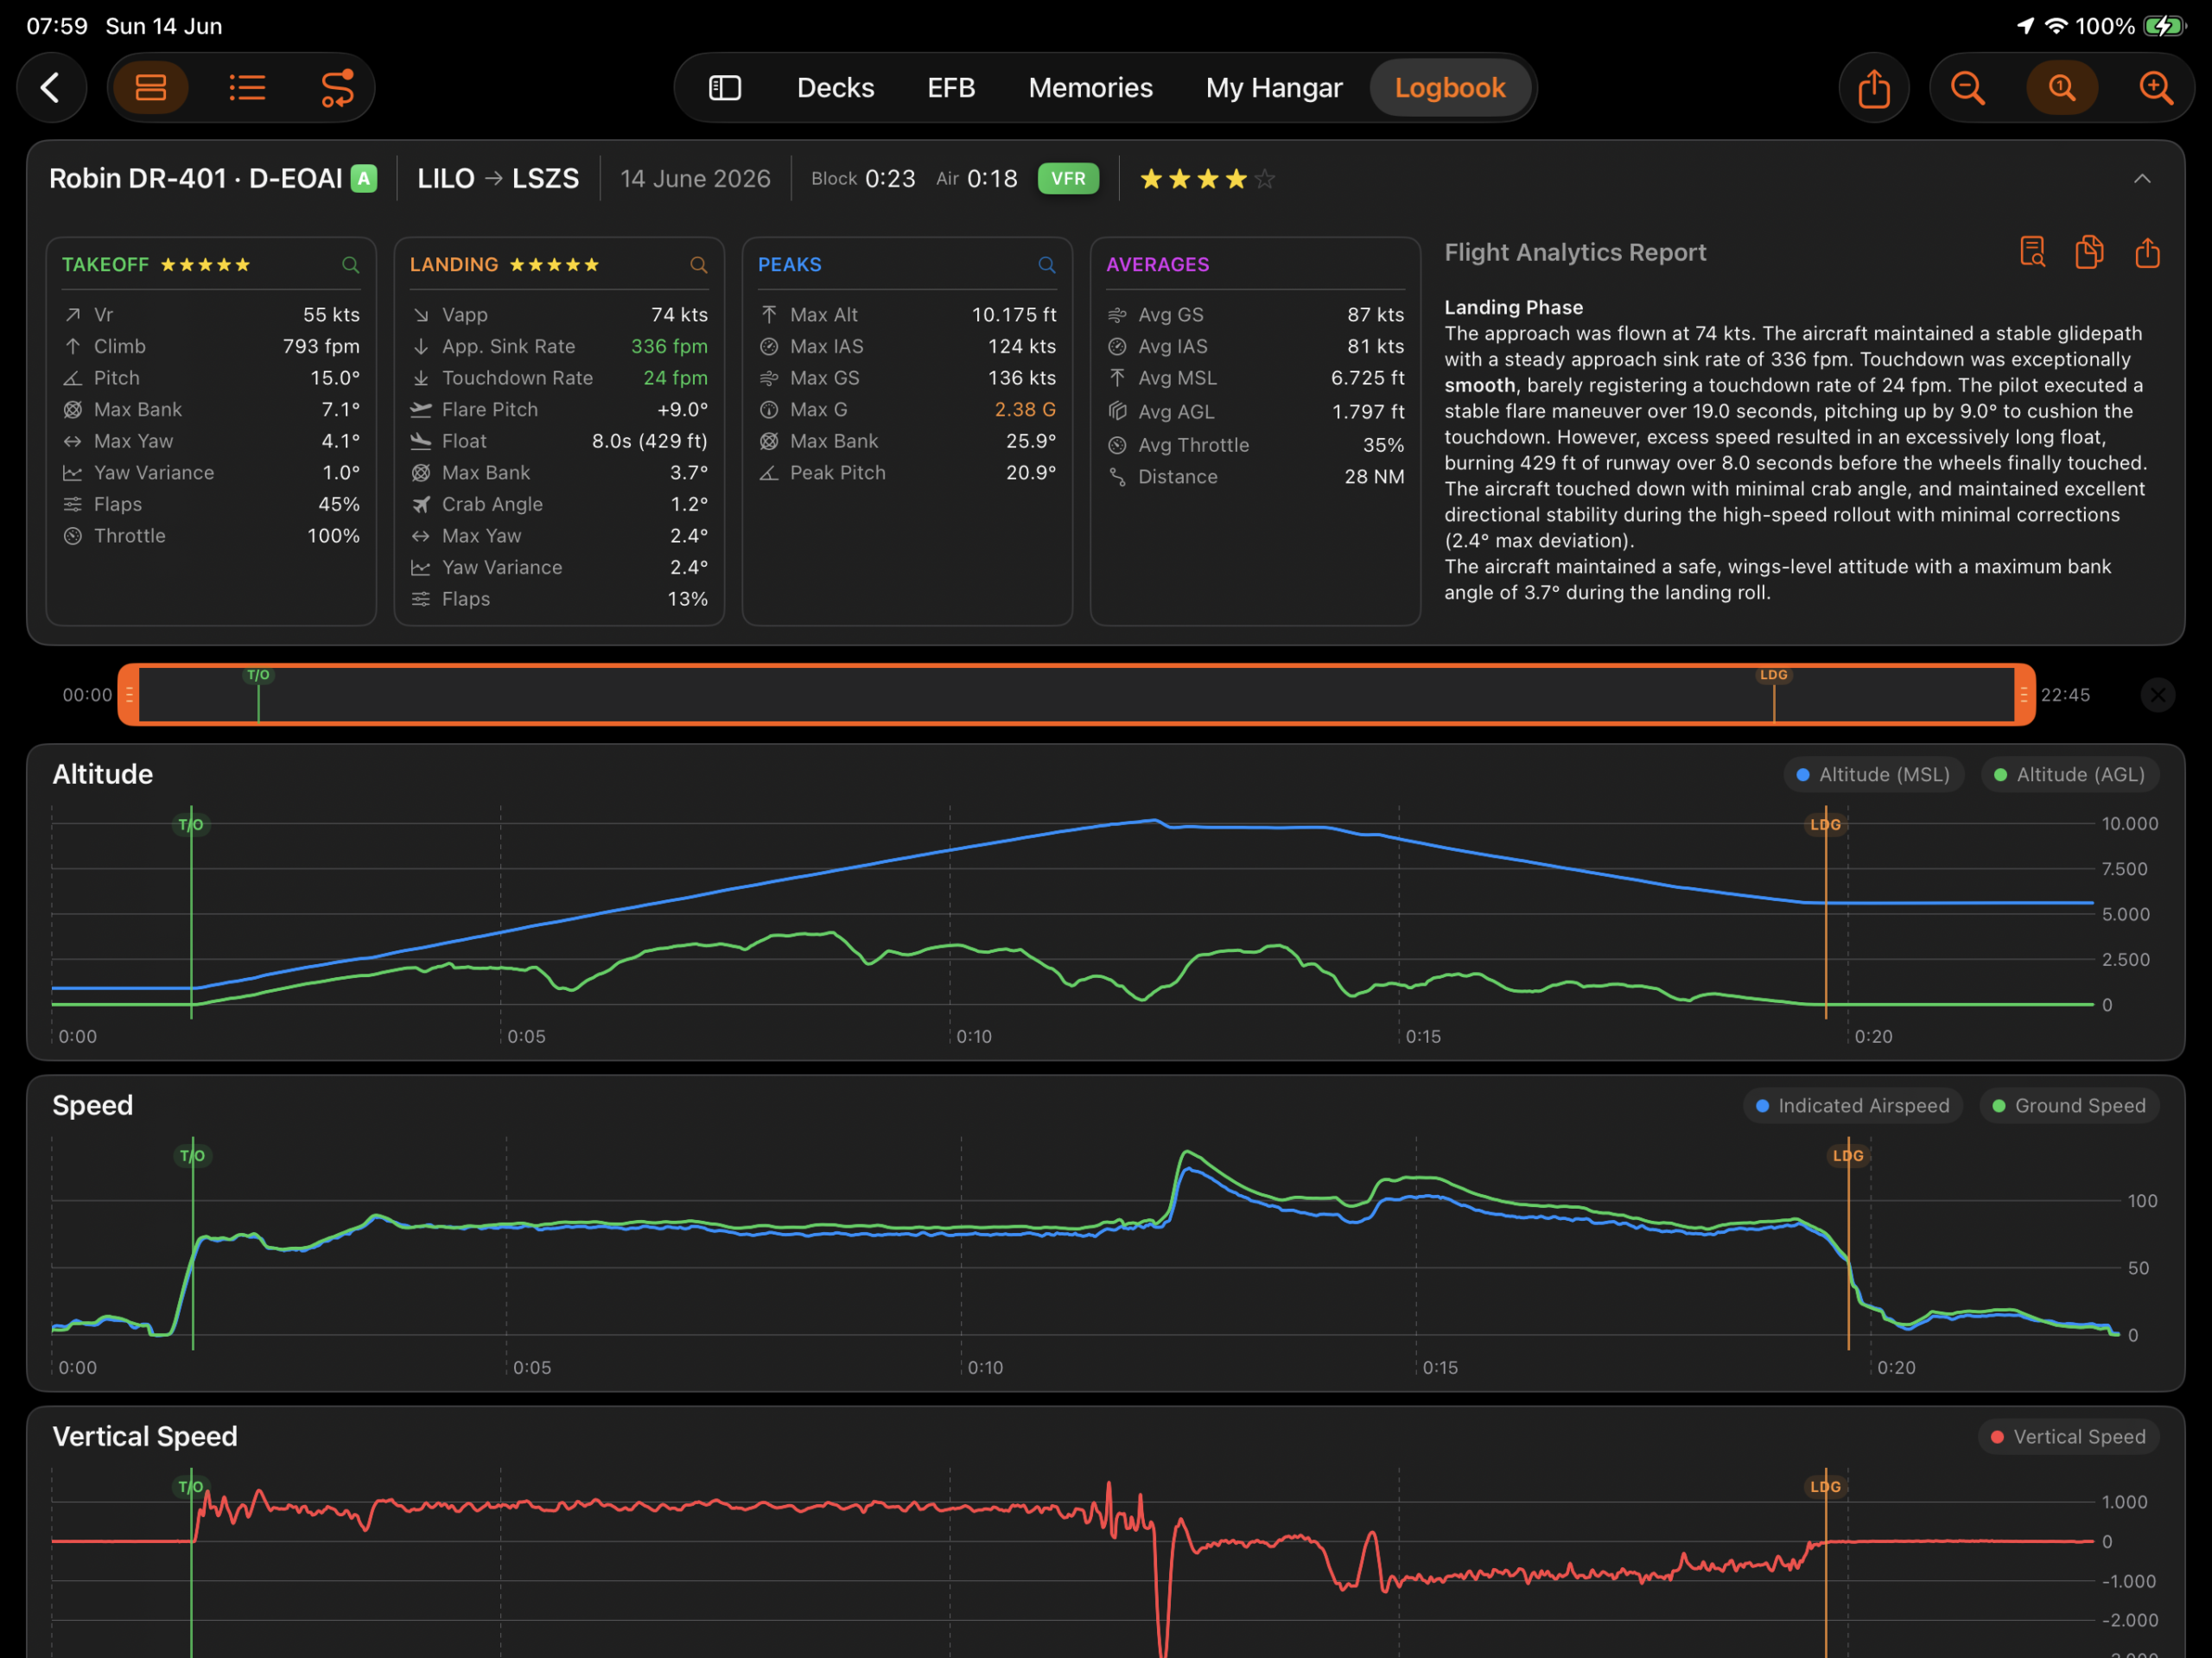
The Highlights section is the first thing you see: a compact, horizontally scrollable strip that summarises your flight in four phase cards — Takeoff, Landing, Peaks, and Averages.
The flight header sits above the cards and shows the aircraft name, route, date, block and air times, and your overall rating. Tap the collapse arrow to hide the header and give more room to the charts below.
Takeoff card (green). Shows rotation speed (Vr), initial climb rate, pitch at rotation, maximum bank angle, yaw deviation, flap configuration, and throttle setting at liftoff. A 1–5 star rating appears at the bottom — computed automatically by Black Box AI against the thresholds for your aircraft category. If the computed rating differs from what you logged manually, a refresh icon appears next to it. Tap it to sync the flight record to the AI’s assessment with a single tap.
Landing card (orange). Shows approach speed (Vapp), approach sink rate, touchdown rate, flare pitch delta, maximum bank angle, crab angle at touchdown, and yaw control during rollout — again with an AI-computed star rating and the one-tap sync button.
Peaks card (blue). Shows the maximum values recorded across the entire flight: altitude, indicated airspeed, ground speed, G-force, bank angle, and peak pitch angle. Use the left and right arrows to cycle through each peak type. Tap the magnifier icon and the timeline below jumps to a 60-second window centred on that peak.
Averages card (purple). Shows mean ground speed, airspeed, MSL and AGL altitudes, average throttle position, and total distance in nautical miles — the steady-state picture of the cruise phase.
Tapping a phase card focuses the timeline to that flight phase. Tap it again to return to the full view.
Flight Analytics Report. When there is enough horizontal space, the Flight Analytics Report appears inline to the right of the phase cards — a full written analysis of your flight generated by Black Box AI. Three buttons sit alongside it: one to open the full report in a dedicated sheet, Copy to copy the text, and Share to send it on directly. On smaller screens or in compact layouts, the report is accessible from the Highlights header instead.
The Timeline and Charts
Below the Highlights, the Charts view displays your telemetry as interactive line charts grouped by metric. Six card groups are available:
- Altitude — MSL and AGL together on a single chart
- Speed — Indicated airspeed and ground speed overlaid
- Vertical Speed — Rate of climb and descent throughout the flight
- Attitude — Pitch and bank angle
- G-Force — Normal G with severity shading
- Controls — Throttle, flaps, and other input positions
Reading a chart. Drag across any chart to move a cursor and read interpolated values at that moment. Each chart shows a green T/O marker at liftoff and an orange LDG marker at touchdown. Values that cross a severity threshold are colour-coded: green for normal, yellow for caution, orange for elevated, and red for severe.
Tap the legend button on any card to open a statistics popover with the minimum, maximum, and average for that metric, plus a table of every significant change during the flight.
Card size. Three size buttons (small, medium, large) in the toolbar adjust how much each chart shows at a glance.
Zoom Ribbon. The scrubber at the bottom of the view gives a bird’s-eye view of the full flight. Drag the handles to set a zoom window, or pan across the ribbon to scroll. The T/O and LDG markers are visible here too. Tap Clear to reset to the full recording.
Table view. Tap the list icon in the toolbar to switch to the Table view: a searchable, filterable log of every raw event recorded. Use the search field and filter tokens — by severity level (Caution, Warning, Critical) or by metric type — to find exactly the moments you want. Toggle the grouping button to switch between chronological order and grouping by metric.
Flight Analytics Report
The Flight Analytics Report is generated by Black Box AI directly from your telemetry. When there is enough space, it appears inline to the right of the phase cards in the Highlights strip. A button to the left of Copy opens the full report in a sheet for a focused reading view. On smaller screens or in compact layouts, the report can be opened from the Highlights header.
The report is structured in four sections — Takeoff, Airborne, Procedures, and Landing — and describes what happened in plain language matched to the severity of the data. A well-coordinated takeoff is described accordingly; a firm touchdown notes the rate and calls it out clearly. If the aircraft exceeded 250 knots below 10,000 feet at any point, the Procedures section flags it as a critical deviation.
PDF Export
Tap the share icon in the toolbar to open the Export Panel. A preview of the key figures from the analysis — rotation speed, climb rate, approach speed, sink rate, max G-force, max altitude, and total distance — is shown with severity colours applied so you can verify the results before exporting.
Two format options are available:
- Compact (One Page) — an A4 landscape page with the flight header, a three-column stats block covering Takeoff, Peaks & Procedures, and Landing, plus two sets of phase charts: a takeoff window and a landing window.
- Include Narrative Report — adds a second page with the full text of the Flight Analytics Report.
Tap Save to Files to write the PDF to any location on your device, or Share to send it via AirDrop, Mail, or any other share destination.
Analyzer Settings
Black Box AI adapts its analysis to the type of aircraft you flew. The category is derived automatically from the aircraft record — General Aviation aircraft are evaluated against GA standards, while Business Jets and Airliners are compared against the tighter bank, yaw, and touchdown limits appropriate for those types.
Tap the ⓘ button in the Highlights header to open the Analysis Strictness popover. A segmented control lets you switch between three modes:
- Lenient — Forgiving flight evaluations combined with a visually smoothed landing chart. The AI relaxes limits for metrics like sink rate, bank angle, and G-forces, and shifts the touchdown marker to the median point between main gear impact and the moment the aircraft fully settles, giving a softer final score.
- Standard — Standard commercial aviation limits with exact real-world landing physics. Touchdown is recorded at the exact millisecond of main gear impact, identical to real-world FOQA data recorders.
- Strict — Highly rigid professional standards with exact real-world landing physics. All flight rating limits are significantly tightened, with virtually no margin for error.
A Learn more about aviation physics link in the popover expands each mode’s description with additional detail on how the thresholds work.
At the bottom of the popover, two buttons let you decide how the change applies:
- Apply to this Flight Only — re-runs the analysis with the selected strictness for this flight without changing your default.
- Save as Default — applies the mode to this flight and saves it as the default for all future analyses.
G-force limits and the overspeed check are fixed regardless of the strictness level chosen.
Ratings and the Logbook
Black Box AI computes a 1–5 star rating for each phase independently, then combines them into an overall rating — weighted toward Landing (3×), Takeoff (2×), and Procedures (1×), reflecting how most pilots and instructors prioritize the phases of a flight.
These ratings sit alongside the ones you enter manually in the flight record. When the AI’s assessment differs from your manual entry, the sync button in the Highlights card makes it trivial to adopt the objective score with a single tap.